
Elif Guldu
Akdeniz University, Institute of Natural and Applied Sciences, Program of Remote Sensing and GIS, Antalya, Turkey,Cagdas Kuscu Simsek
Akdeniz University, Faculty of Science, Department of Space Sciences and Technology, Antalya, TurkeyIn this study, cool island (CI) potentials as urban parks and green spaces of Antalya where it is in the Mediterranean climate belt were investigated by handling together with their peripheries’ urban morphology. Surface temperature data were obtained by remote sensing methods using Landsat 8 satellite images. In the study where the GIS techniques were used, the relationships between the cool islands and their surrounding urban texture were analyzed by statistical methods. The results indicate that while the density of adult trees in urban green spaces increases the cooling capacities and cooling distances of green spaces, the morphological characteristics of the peripheries of green spaces change their cooling distances. It is thought that these findings are constituted an important basis for the development of the climate-sensitive urban planning and urban design approach.
1. Introduction
Rapid urbanization is one of the major causes affecting global climate change. Today 55% of the world’s population lives in cities, and this figure is expected to reach 68% by 2050 (Yu et al. 2020). Destroying natural surfaces in cities and replacing them with concrete surfaces are among the causes that trigger global climate change. As a result of climate change, temperatures increase and natural disasters such as extreme weather events, floods, droughts occur (Du et al., 2017; Aygun and Torlak, 2019; McCarthy et al., 2010). Just as global climate change has negative effects on cities, changes in cities seem to cause an increase in global climate change (Sharifi, 2021).
Since most people prefer to spend time outside when the climatic conditions are suitable, ensuring the thermal comfort of the city is vital. According to Matzarakis (2017), ideal thermal comfort standards for humans are between 18 ° C-23 ° C. With increasing urbanization, the temperature rise in cities creates environments that go beyond standards of human comforts and this situation sometimes causes people to lose their lives. It is known that 70,000 people died in Europe in 2003 and 55,000 in Russia in 2010 due to heatwaves (Robine et al., 2008; Otto et al., 2012; Barriopedro et al., 2011). For this reason, it is necessary to provide thermal comfort in cities, to create action plans, and develop solutions. But since each city’s geographical location, topographic and morphological structure, population density, lifestyles of those who live in the city are different, the climatic characters of the cities are also different. Therefore, the climatic characteristics of each city should be revealed and appropriate strategies should be developed (Kuşçu Şimşek, 2020). Looking at ancient settlements in cities, it seems that climate plays a crucial role, from the design of houses and cities to the selection of building materials for buildings. For example, in cold climate zones, buildings are built with thick walls, while windows and openings are built narrow. In temperate and warm regions, the distance between the buildings was kept wide, and light colors were preferred on the outer walls of the buildings (Çınar and Erdoğan, 2019). In areas with heavy rainfall, buildings are built on platforms to reduce the effect of humidity, while in areas with heavy snowfall, houses are built close to each other using high-pitched roofs (Kısa Ovalı, 2019). Large courtyards with fountains or small pools were built to benefit from the cooling effect of water in regions where summer months are hot (Tunçalp et al., 2002). However, with increasing urbanization, priorities have also changed and the climate parameter has remained in the background both at the planning scale and at the building scale. The mass deaths, especially in cities with climate change, have increased the importance of climate-sensitive planning and design studies (Newman, 2020).
Especially in recent years, the phenomenon of the urban cold island is come to the forefront in reducing the urban heat island effects due to being cost-effective, environmentally friendly, and easily applicable. (Byrne and Jinjun, 2009; Carvalho et al., 2017; Masoudi and Tan, 2019; Qiu and Jia, 2020; Aram et al., 2019). The regions that have a lower temperature than the temperature of their environment and can cool their environment like green areas, forests, street afforestation, water surfaces, and coasts are defined as cold islands of the urban area (Honjo and Takakura, 1990; Jauregui, 1990; Feyisa et al., 2014; Masoudi and Tan, 2019; Ren et al., 2018; Wu and Zhang, 2019). The effects of urban cold islands are measured by their cooling densities and cooling distances (Figure 1). While the cooling density is defined by the difference between the maximum temperature of the urban area and the minimum temperature of the green area, the cooling distance is defined by the distance from the edge of the cold island to the point where the cooling effect disappears (Honjo and Takakura, 1990).
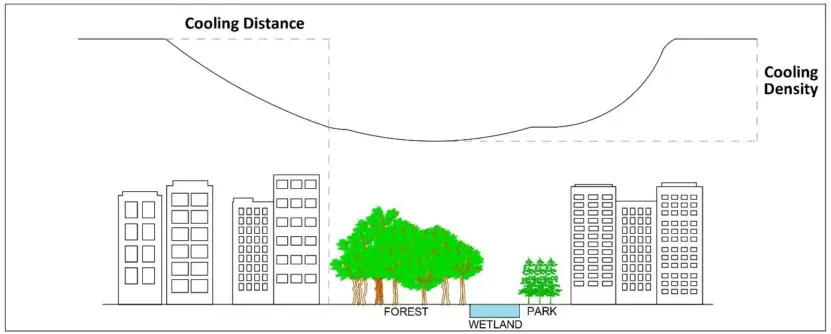
Figure 1.Thermal effect of urban cold islands
Green areas help reduce air temperature by clearing the air, providing wind circulation, regulating precipitation patterns, providing the direct shading of surfaces, and reducing the absorption of solar heat by plants through evaporation (MacDonald, 2007; Ellison et al., 2017; Moss et al., 2019). However, factors such as the size, the morphological characteristics of their peripheries, the density of their cooling factors, the presence of other cold islands, the wind velocity, and the climatic characteristics of the city affect the cooling distance and the density of cold islands (Du et al., 2017; Naeem et al., 2018; Bernard et al., 2018). Therefore, to maximize the efficacy of the cooling density and the cooling distance of cold islands, the physical characteristics of both the cold islands and the peripheries of them should be evaluated together. For example, it is known that the landscape design of green areas, the species of trees they contain, the ratio of impervious surfaces, and the water body in the green area are affected the potentials of cold islands’ (Jaganmohan et al., 2016; Grilo et al., 2020).
Two different methods are used for the determination of urban cold islands. The first one is the terrestrial measurements which is a conventional method (Park et al., 2019), and the second one is the remote sensing method by which surface temperatures are determined using satellite images with thermal bands such as Landsat, Aster, Sentinelle-2 (Cao et al., 2010; Xue et al., 2019). The method to be selected varies depending on the aim and scale of the study. Both methods have advantages and disadvantages over each other. Since the traditional method uses data from meteorological stations, the data is more sensitive, but especially in large areas, the limited number of stations that can be used due causes a decrease in sensitivity. On the other hand, the number of surface temperature data that are obtained by remote sensing techniques varies depending on the image resolution. By this way, too much data can be collected at one time in the study area that cannot be obtained with terrestrial stations. Therefore, the combined use of both conventional and remote sensing methods will allow us to obtain more accurate results.
In this study, the cooling potentials of the forests and urban green areas of Antalya city, located in the Mediterranean climate zone where air temperature and humidity are very high, were investigated. The interactions between the cooling capacities of the parks and the morphological characteristics of their surroundings were analyzed in meso-scale and micro-scale.
2. Method
2.1. Study Area
The province of Antalya where is located between the Gulf of Antalya and the Western Taurus Mountains in the west of the Mediterranean Region, at 36°N, 30°E coordinates. According to the 2019 TURKSTAT data, the city has 19 districts and it has a total population of 2.511.700 people. It is the 5th most populous city in Turkey. In the city where the Mediterranean climate prevails with hot and dry summers and warm and rainy winters, there are mainly plants of maquis species as natural vegetation. In this study, Aksu, Döşemealtı, Kepez, Konyaaltı, and Muratpaşa districts, which are the central districts of Antalya, were determined as the study area (Figure 2).
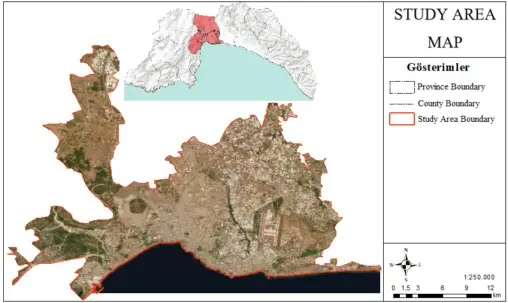
Figure 2. Study area
2.2. Method
The main aim of the study was the examination of the relationship between cooling capacities (cooling density and cooling distance) of urban green areas and the morphological structure of their peripheries. Therefore, the morphological characteristics and cold island potentials of the city were first determined, and texture types and cold islands were classified within themselves. In this study, the climate-based classification method of urban texture, which was developed by Stewart and Oke (2012) was used. In this method, texture types are divided into 10 classes, and land cover types are divided into 7 classes (Table 1). When the texture types of Antalya were classified according to this method, 8 classes as compact high-rise, mid-rise and low-rise, open high-rise, mid-rise, low-rise, sparsely built, and port were determined (Figure 3). On the other hand, the green areas were classified according to the classification type that has 8 main categories, and 44 sub-categories that were used by Rall et al. (2015). In this method, the greenness density, size, usage type, and vegetation type are used for classification. However, two new classes were created for maquis shrublands that constitute the vegetation of the city of Antalya, and mixed areas (places where woodland and maquis shrubland exist together) which are not included in this classification (Figure 4). Among the green areas, a total of 15 green areas, including 4 forests, 1 mixed area, 3 maquis shrublands, 1 large urban green area, 4 green playgrounds, 1 cemetery, and 1 citrus garden, were selected to be examined in the study (Figure 5).
The study was conducted using satellite images due to it covered the whole city and there wasn’t enough terrestrial station. Landsat 8 satellite images for 5 summer periods and 3 winter periods of the years 2018-2019 were used in the study.
Firstly, the Landsat 8 bands were corrected according to the radiometric calibration parameters (USGS, 2019). Then, to be able to calculate the surface temperatures, the NDVI (normalized difference vegetation index) and the ε (emissivity) images which highlight the reflection properties of surface elements that will be used in the formula were prepared. The emissivity images were calculated by using the NDVI Threshold Method formulated by Sobrino et al (2008). Lastly, the surface temperatures were calculated separately for all thermal images through the Radiative Transfer Equation method (Jiménez-Muñoz et al., 2008).
Buffer zones were created to determine the influence areas of cold islands. At this step, the literature reviews were considered while determining the upper boundaries of the buffer zones. While 3000 m buffer zones were created for forests, 1500 m and 500 m buffer zones were created for green areas and green playgrounds, respectively. The buffer zones were divided into zones within themselves according to the shape of the green area and peripheries’ texture types. The correlation of the relationship between temperatures and distances in each zone was examined, and also analyses were repeated for buffer zones at different distances. According to these results, distances with the highest correlation were considered as the new upper boundary. The new boundaries were determined as 500 m for forests and green areas, and 100 m for green playgrounds. In statistical analysis, the normality tests of the data were first performed, and then, the correlation analysis was performed to find the direction and degree of the relationship between distance and surface temperature. At this step, after the ANOVA tests that were performed to reveal whether there was a significant relationship between textures, scatter plots were created to understand the cooling distance and cooling density. The difference between the temperature of the edge of the cold island and the temperature of the point where the cold island’s effect ends was examined to observe differentiation in texture types while calculating the cooling density.
Table 1. Urban texture classification (Stewart and Oke, 2012)
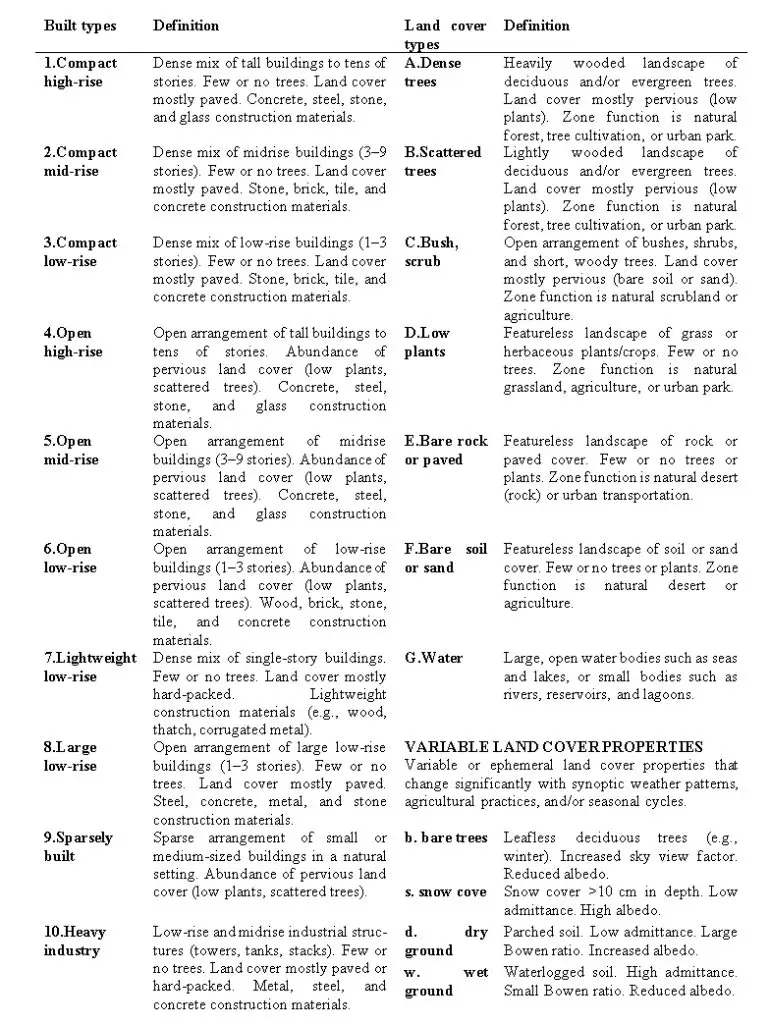
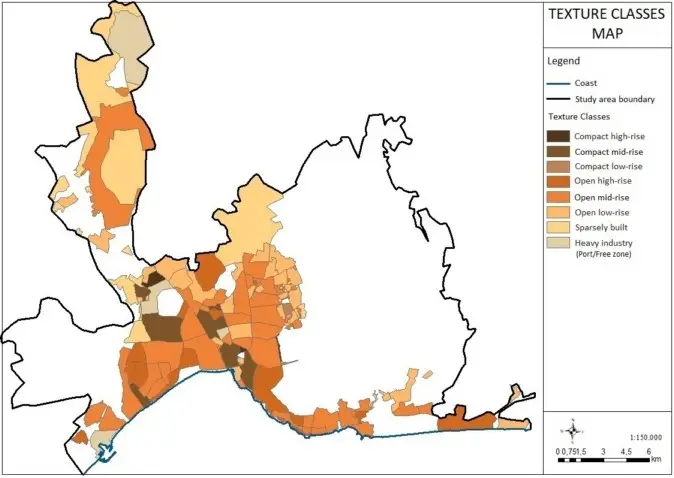
Figure 3. Texture classes map of Antalya
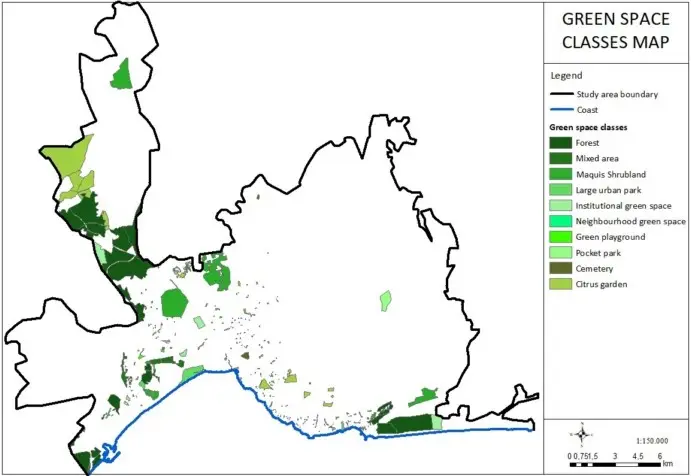
Figure 4. Green areas
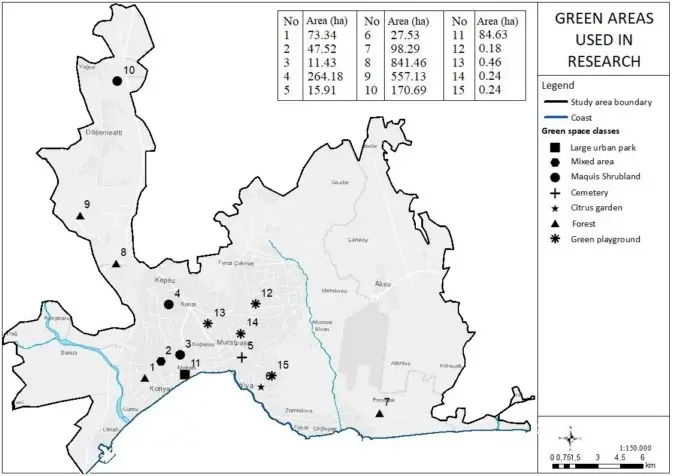
Figure 5. Green areas used in the study
3.Results
3.1. Maquis Shrubland
Green areas numbered 3, 4, and 10 were examined as an example of maquis shrubland. When the correlation results between zone/texture and distance were examined, it was observed that textures exhibited different correlations if sub-factors (under the influence of another cold island or heat island, dominant microclimate zone due to different factors, etc.) were not effective. As a result of the ANOVA tests performed to understand whether this differentiation of the textures was significant, it was determined that temperatures in the texture types differed significantly from each other and that there was a mix only between open mid-rise and compact mid-rise texture types. Scatter plots were created according to both zones and texture types to observe temperature changes around maquis shrublands (Table 2). When the graphs were examined, it was determined that the cooling distance of the maquis shrubland was 200 m on average in summer but could increase up to 300 m depending on the texture type and other environmental factors. On the other hand, this was determined 350 m on average in winter seasons (Table 3).
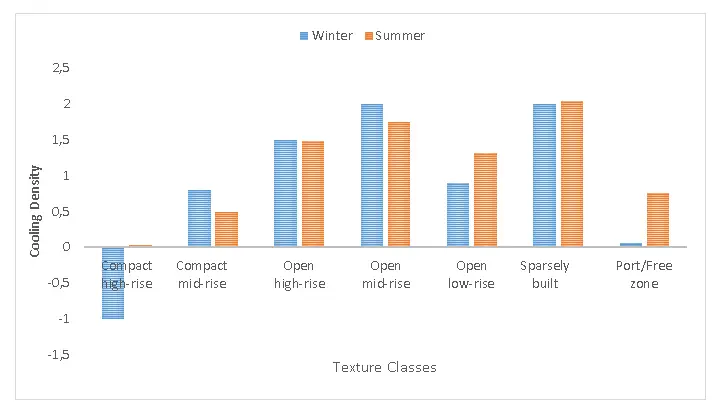
Furthermore, when the cooling effect density differences were investigated for summer months; 1.7ºC in open mid-rise textures, 1.5ºC in open high-rise textures, 1.3 ºC in sparsely built textures, 0.75ºC in the port/free zone texture, and -0.6ºC in compact mid-rise textures were observed. On the other hand, when these differences were examined for winter months; 2 ºC in open mid-rise textures, 1.5 ºC in open high-rise textures, 0.3 ºC in sparsely built textures, 0.01 ºC in compact mid-rise textures, and 0.01 ºC in the port/free zone texture were observed.
3.2. Forests
Forests were exemplified with the areas numbered 1, 7, 8, and 9. However, the presence of large green areas and forest patches in urbanized areas that are near the examined forests prevented the precise measurement of cooling distance and density differences. The ANOVA tests revealed that temperatures in different texture types around the forest differed significantly. When the cooling effect density differences were investigated for the summer months; the temperature differences were observed as 2 ºC in sparsely built areas, 1.3ºC in open low-rise areas, 0.9 ºC in open mid-rise areas, and 0.2 ºC in compact mid-rise areas. In winter months, these changes were observed as 0.9 ºC in open low-rise and mid-rise areas and 0.8 ºC in compact mid-rise areas. In sparsely built areas, there were no changes observed.
3.3. Mixed Areas
The green area numbered 2 was sampled as an area with a mixed structure. However, no significant relationship was determined between the distance to the cold island and the surface temperature, due to the influences of large green areas around it and the coast.
3.4. Citrus Garden
The peripheries of the sample area numbered 6, which is the largest citrus garden that remained in the city, is covered with a uniform texture. In this area, it was observed that there was a significant correlation between distance and surface temperature. In winter the cooling distance was 350 m on average in open high-rise areas and could reach up to 500 m during the summer months. It was determined that the cooling effect density difference in this area was approximately 1 ºC in summer and 0.2 º in winter.
3.5. Cemetery
The cemetery area in the city center was sampled with number 5 is covered with adult trees. It was observed that surface temperatures in different texture types around the cemetery have differed significantly. When the graphs were examined, it was determined that the cooling distance of the cemetery area was 300 m on average, but it could increase up to 500 m. When the cooling effect density difference according to texture types was investigated, it was found to be approximately 1 ºC in open mid-rise areas, and 0.7 ºC in open low-rise areas, 0.4 ºC in compact mid-rise areas, and -0.5 ºC in compact high-rise areas during the summer months. The cooling effect density difference in winter months, -1.2 ºC in open mid-rise areas, 0.8 ºC in open low-rise areas, 0.4 ºC in compact mid-rise areas, and -1.4 ºC in compact high-rise areas were determined.
3.6. Large Urban Green Area
The green area numbered 11 was investigated as an example of a large urban green area. The results showed that the correlations between distances to the green area and surface temperature were varied due to the near position of the park to the coastal line, which is another cold island. When the graphs were examined, it was observed that the cooling distance of the large urban green area could reach up to 300 m in the summer seasons depending on the texture type. However, this distance has remained at 200 m in the winter seasons. When the cooling effect density difference in texture types was examined, it was found to be 0.8 ºC in open high-rise textures and 0.7 ºC in open mid-rise textures during the summer months. In winter, these differences were determined as 0.8 ºC in open high-rise textures and -1.2 ºC in open midrise textures.
3.7. Green Playground
Since green playgrounds are small areas, in general, texture differences cannot be observed in their peripheries. Therefore, 4 green playgrounds with 4 different texture types were selected as a sample. It was determined that green playgrounds had a cooling distance of up to 80 m. Cooling effect density differences were determined respectively as -0.2 ºC in compact midrise textures, 0.1 ºC in open high-rise textures, 0.3 ºC in open mid-rise textures, and 0.4 ºC in open low-rise textures. On the other hand, these differences were changed as -0.3 ºC in compact mid-rise texture, 0.3 ºC in open high-rise textures, 0.1 ºC in open mid-rise textures, and 0.3 ºC in open low-rise textures during the winter months.
Table 2. Surface temperature scatter plots of cold islands by distance (graphs show the single year sample)
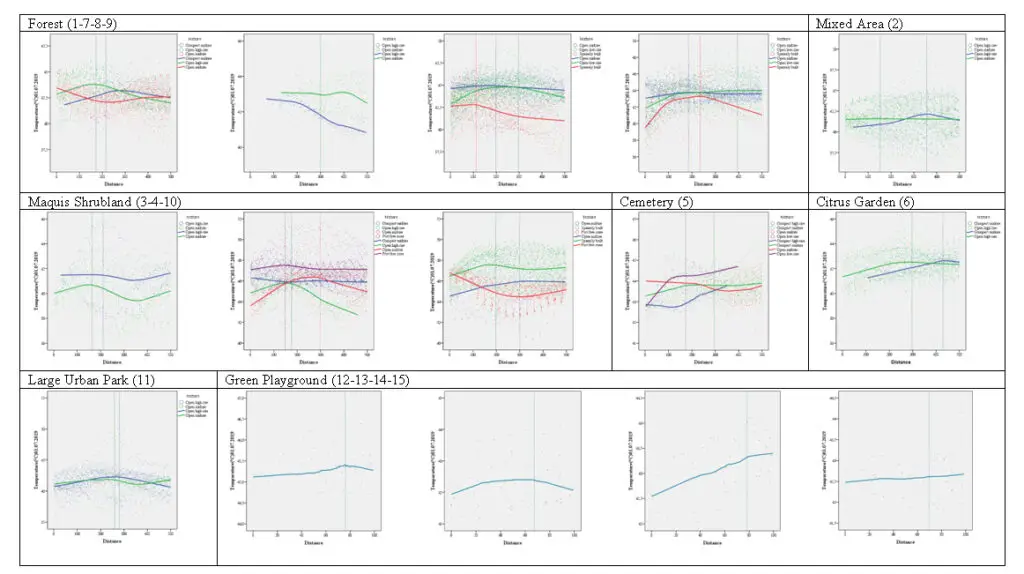
Table 3. Break points and maximum surface temperature differences

Table 4. Cooling densities of green areas according to texture types
4. Discussion
The fact that global warming is felt more prominently with each passing day and the increase in morbidity and mortality rates resulting from sudden weather changes caused the providing climate comfort of the outdoors to be included in the current issues of planning. Therefore, a wide range of solutions, from land-use planning to architectural design, should be proposed to provide climate comfort in urban areas. In this context, methods such as the construction of energy-efficient compact settlements, green buildings, roof gardens, vertical gardens with the use of ecological materials are suggested. However, it is not possible for these costly solutions to be implemented or effective in the whole city. In this case, the phenomenon of urban cold islands appears as a method that should be considered in providing climate comfort since it is much more effective, cheaper, and applicable to the whole city.
First, the cold island potentials of the urban area should be determined, and cooling distances and cooling densities should be calculated to effectively benefit from cold islands in the urban area. In this study, the city of Antalya was selected as a sample area, based on 15 cold island samples, including maquis shrubland, forests, mixed areas, citrus garden, cemetery, large urban green area, and green playgrounds; the cooling distances and cooling effect density differences were examined together with the morphological structures of their peripheries. According to the results obtained, it was determined that while the forest, citrus garden, and cemetery area had a cooling distance of up to 500 m, mixed areas with maquis and tall trees had a cooling distance of up to 350 m, maquis areas and the large urban green area had a cooling distance of up to 300 m, and green playgrounds had a cooling distance of up to 80 m.
When the consistency of the results with the literature was examined, the fact that the large urban green area with adult trees had a cooling distance of up to 300 m and that the cemetery area and citrus garden had a cooling distance of up to 500 m was observed to be consistent with the cooling distances of 300 m – 500 m specified for green areas with similar structure in the literature (Hamada and Ohta, 2010; Doick et al., 2014; Yu and Hien, 2006). Furthermore, it was observed that the 80 m cooling distance of green playgrounds that can be described as the smallest green areas was also consistent with 80 m cooling distances determined for small green areas by Gargiulo et al. (2016). According to our results, while the cooling distance of forests was 500 m, Kuşçu Şimşek (2020) found in their study that forests had an effect up to 3 km. However, as mentioned before, maquis shrublands, forest patches, or large green areas located near the forests examined in this study interrupt the measuring of the cold island effect of forests and cause it to observed in the first 500 m. But, based on the literature data, it is considered that forests will have a greater cooling distance.
When the cooling distance and density of green areas were examined, it was observed that maquis shrublands had less effect since their tree shade ratio was low. However, green areas such as forests, cemetery areas (have dense adult trees), and citrus garden (orchards) with a high tree shade ratio had a higher effect.
When the capacity of texture types to take advantage of cold islands was examined, it was determined that sparsely built areas and open mid-rise areas constituted the texture group that mostly benefited from the cooling effect of green areas in both seasons (Table 4). The cooling distance and the cooling density of urban cold islands are affected by the characteristics of surrounding buildings, such as volume, height, and density (Shih, 2020; Xue et al., 2019; Masuda et al., 2005). According to the results obtained, it was determined that the influence areas of cold islands differed according to the texture type around them. Furthermore, areas with an open design made better use of the cooling effect of cold islands compared to compact areas. These results, which are consistent with the literature, reveal that the cold island should be planned together with its environment to make effective use of cold islands.
5. Conclusions
In this study, cold islands’ cooling distances and cooling effect density differences were calculated using satellite images. The results obtained here were evaluated over the surface temperatures, and factors affecting the climate such as humidity, wind, and air quality could not be used as data due to the lack of a sufficient number of terrestrial stations within the urban area. To increase the sensitivity of the study, problematic points should be detected by remote sensing, and both remote sensing and terrestrial measurements should be used together in such studies.
In conclusion, urban cold islands and the cooling effect they create are of great importance in providing climatic comfort in our cities. However, the effective capacity of cold islands is related to both the cold island’s design and the design of its environment. Therefore, urban climate should be discussed basically within the framework of climate-sensitive planning and design approach with solution proposals covering the whole city. Forests, green areas, and water surfaces in our cities should be protected, green areas should be increased, and designs with open and abundant green areas should be made instead of high-density crowded designs that lack green areas. Besides, the distribution of green spaces within the city will allow various parts of the city and more stakeholders to benefit from the cold island effect. In future studies, it should not be forgotten that textures have different characteristics in different areas, and the morphological structure of the surroundings of cold islands should be evaluated by being addressed separately.
Aram, F., García, E. H., Solgi, E., & Mansournia, S. (2019). Urban green space cooling effect in cities. Heliyon, 5(4), e01339. https://doi.org/10.1016/j.heliyon.2019.e01339
Aygün, A., & Torlak, S.E. Denizli İli’nin İklim Değişikliğine Karşı Dayanıklılığının İncelenmesi (An Examinat, on Climate Change Resilience on Denizli). Niğde Ömer Halisdemir Üniversitesi Mühendislik Bilimleri Dergisi, 9(1), 648-664. https://doi.org/10.28948/ngumuh.629809
Barriopedro, D., Fischer, E. M., Luterbacher, J., Trigo, R. M., & García-Herrera, R. (2011). The hot summer of 2010: redrawing the temperature record map of Europe. Science, 332(6026), 220-224. DOI: 10.1126/science.1201224
Bernard, J., Rodler, A., Morille, B., & Zhang, X. (2018). How to design a park and its surrounding urban morphology to optimize the spreading of cool air?. Climate, 6(1), 10. https://doi.org/10.3390/cli6010010
Byrne, J., & Jinjun, Y. (2009). Can urban greenspace combat climate change? Towards a subtropical cities research agenda. Australian Planner, 46(4), 36-43. https://doi.org/10.1080/07293682.2009.10753420
Cao, X., Onishi, A., Chen, J., & Imura, H. (2010). Quantifying the cool island intensity of urban parks using ASTER and IKONOS data. Landscape and urban planning, 96(4), 224-231. https://doi.org/10.1016/j.landurbplan.2010.03.008
Carvalho, D., Martins, H., Marta-Almeida, M., Rocha, A., & Borrego, C. J. U. C. (2017). Urban resilience to future urban heat waves under a climate change scenario: A case study for Porto urban area (Portugal). Urban Climate, 19, 1-27. https://doi.org/10.1016/j.uclim.2016.11.005
ÇINAR, H. S., & ERDOĞAN, R. (2019). Geleneksel bahçe ve mimari üslubun ortaya çıkışında doğal faktörlerin rolü: İran örneği (The Role of Natural Factors in the Emergence of Traditional Garden and Architectural Style: The Case of Iran). Bartın Orman Fakültesi Dergisi, 21(3), 685-699. https://doi.org/10.24011/barofd.583185
Du, H., Cai, W., Xu, Y., Wang, Z., Wang, Y., & Cai, Y. (2017). Quantifying the cool island effects of urban green spaces using remote sensing Data. Urban Forestry & Urban Greening, 27, 24-31. https://doi.org/10.1016/j.ufug.2017.06.008
Doick, K. J., Peace, A., & Hutchings, T. R. (2014). The role of one large greenspace in mitigating London’s nocturnal urban heat island. Science of the total environment, 493, 662-671. https://doi.org/10.1016/j.scitotenv.2014.06.048
Ellison, D., Morris, C. E., Locatelli, B., Sheil, D., Cohen, J., Murdiyarso, D., … & Sullivan, C. A. (2017). Trees, forests and water: Cool insights for a hot world. Global Environmental Change, 43, 51-61. https://doi.org/10.1016/j.gloenvcha.2017.01.002
Feyisa, G. L., Dons, K., & Meilby, H. (2014). Efficiency of parks in mitigating urban heat island effect: An example from Addis Ababa. Landscape and urban planning, 123, 87-95. https://doi.org/10.1016/j.landurbplan.2013.12.008
Gargiulo, C., Tulisi, A., & Zucaro, F. (2016). Small green areas for energy saving: effects on different urban settlements. http://doi.org/10.5821/ace.11.32.4659
Grilo, F.; Pinho, P.; Aleixo, C.; Catita, C.; Silva, P.; Lopes, N.; Freitas, C.; Santos-Reis, M.; McPhearson, T.; Branquinho, C. (2020). Using green to cool the grey: Modelling the cooling effect of green spaces with a high spatial resolution. Science of The Total Environment, 724, 138182, https://doi.org/10.1016/j.scitotenv.2020.138182
Hamada, S., & Ohta, T. (2010). Seasonal variations in the cooling effect of urban green areas on surrounding urban areas. Urban forestry & urban greening, 9(1), 15-24. https://doi.org/10.1016/j.ufug.2009.10.002
Honjo, T., & Takakura, T. (1990). Simulation of thermal effects of urban green areas on their surrounding areas. Energy and buildings, 15(3-4), 443-446. https://doi.org/10.1016/0378-7788(90)90019-F
Jaganmohan, M.; Knapp, S.; Buchmann, C.M.; Schwarz, N. (2016). The Bigger, the Better? The Influence of Urban Green Space Design on Cooling Effects for Residential Areas. Journal of Environment Quality, 45(1), 134-145. https://doi.org/10.2134/jeq2015.01.0062
Jáuregui, E. (1990). Influence of a large urban park on temperature and convective precipitation in a tropical city. Energy and buildings, 15(3-4), 457-463. https://doi.org/10.1016/0378-7788(90)90021-A
Jiménez-Muñoz, J. C., Cristóbal, J., Sobrino, J. A., Sòria, G., Ninyerola, M., & Pons, X. (2008). Revision of the single-channel algorithm for land surface temperature retrieval from Landsat thermal-infrared data. IEEE Transactions on geoscience and remote sensing, 47(1), 339-349. https://doi.org/10.1109/TGRS.2008.2007125
Kuşçu Şimşek, Ç., (2020). İstanbul’un mezo ve mikro iklimsel değişiminin kuzey ormanları ve kent içi yeşil alanlarla ilişkisi (The Relationship of Istanbul’s Meso and Microclimatic Change with Northern Forests and Urban Green Areas) Şu esrede: Ünal Akkemik (Ed.). Ekosistem, İklim ve Kentsel Büyüme Perspektifinden İstanbul ve Kuzey Ormanları. Türkiye Ormancılar Derneği Tayın No:
50, Marmara Şubesi Yayın No:4, İstanbul. ISBN: 978-975-93478-7-1. S:96-109.
MacDonald, J., (2007). How Cities Use Parks for Climate Change Management. American Planning Association (APA), Washington. https://www.planning.org/publications/document/9148693/ Date of access: 10.05.2021
Masoudi, M., & Tan, P. Y. (2019). Multi-year comparison of the effects of spatial pattern of urban green spaces on urban land surface temperature. Landscape and Urban Planning, 184, 44-58. https://doi.org/10.1016/j.landurbplan.2018.10.023
Masuda, Y., Ikeda, N., Seno, T., Takahashi, N., & Ojima, T. (2005). A basic study on utilization of the cooling effect of sea breeze in waterfront areas along Tokyo Bay. Journal of Asian Architecture and Building Engineering, 4(2), 483-487. https://doi.org/10.3130/jaabe.4.483
Matzarakis, A., Rutz, F., Chen, Y., Fröhlich, D. (2017). RayMan Pro, A Tool for Applied Climatology, Rayman Manual Version 0.1. https://www.urbanclimate.net/rayman/RayManManual.pdf
McCarthy, M. P., Best, M. J., & Betts, R. A. (2010). Climate change in cities due to global warming and urban effects. Geophysical research letters, 37(9). https://doi.org/10.1029/2010GL042845
Moss, J. L., Doick, K. J., Smith, S., & Shahrestani, M. (2019). Influence of evaporative cooling by urban forests on cooling demand in cities. Urban Forestry & Urban Greening, 37, 65-73. https://doi.org/10.1016/j.ufug.2018.07.023
Naeem, S., Cao, C., Qazi, W. A., Zamani, M., Wei, C., Acharya, B. K., & Rehman, A. U. (2018). Studying the association between green space characteristics and land surface temperature for sustainable urban environments: An analysis of Beijing and Islamabad. ISPRS International Journal of Geo-Information, 7(2), 38. https://doi.org/10.3390/ijgi7020038
Newman, P. (2020). Cool planning: How urban planning can mainstream responses to climate change. Cities, 103, 102651. https://doi.org/10.1016/j.cities.2020.102651
Otto, F. E., Massey, N., van Oldenborgh, G. J., Jones, R. G., & Allen, M. R. (2012). Reconciling two approaches to attribution of the 2010 Russian heat wave. Geophysical Research Letters, 39(4). https://doi.org/10.1029/2011GL050422
OVALI, P. K. BİYOKLİMATİK TASARIM MATRİSİ (TÜRKİYE) (BIOCLIMATIC DESIGN MATRIX (TURKEY)). Trakya Üniversitesi Mühendislik Bilimleri Dergisi, 20(2), 51-66.
Qiu, K., & Jia, B. (2020). The roles of landscape both inside the park and the surroundings in park cooling effect. Sustainable Cities and Society, 52, 101864. https://doi.org/10.1016/j.scs.2019.101864
Rall, L., Niemela, J., Pauleit, S., Pintar, M., Lafortezza, R., Santos, A., … & Železnikar, Š. (2015). A typology of urban green spaces, eco-system services provisioning services and demands. Report D3, 1.
Ren, Z., He, X., Pu, R., & Zheng, H. (2018). The impact of urban forest structure and its spatial location on urban cool island intensity. Urban Ecosystems, 21(5), 863-874. https://doi.org/10.1007/s11252-018-0776-4
Robine, J. M., Cheung, S. L. K., Le Roy, S., Van Oyen, H., Griffiths, C., Michel, J. P., & Herrmann, F. R. (2008). Death toll exceeded 70,000 in Europe during the summer of 2003. Comptes rendus biologies, 331(2), 171-178. https://doi.org/10.1016/j.crvi.2007.12.001
Sharifi, A. (2021). Co-benefits and synergies between urban climate change mitigation and adaptation measures: A literature review. Science of The Total Environment, 750, 141642, https://doi.org/10.1016/j.scitotenv.2020.141642
Shih, W. Y., Ahmad, S., Chen, Y. C., Lin, T. P., & Mabon, L. (2020). Spatial relationship between land development pattern and intra-urban thermal variations in Taipei. Sustainable Cities and Society, 62, 102415. https://doi.org/10.1016/j.scs.2020.102415
Sobrino, J. A., Jiménez-Muñoz, J. C., Sòria, G., Romaguera, M., Guanter, L., Moreno, J., … & Martínez, P. (2008). Land surface emissivity retrieval from different VNIR and TIR sensors. IEEE transactions on geoscience and remote sensing, 46(2), 316-327. https://doi.org/10.1109/TGRS.2007.904834
Stewart, I. D., & Oke, T. R. (2012). Local climate zones for urban temperature studies. Bulletin of the American Meteorological Society, 93(12), 1879-1900. https://doi.org/10.1175/BAMS-D-11-00019.1
TUNÇALP, K., SUCU, M., & OĞUZ, Y. (2002). Değişik İklim Şartlarında Bina İçerisinde Pasif Isıtma Ve Soğutma Sistemlerinin Kullanılabilirliği (Usability of Passive Heating and Cooling Systems in Buildings in Different Climate Conditions). Marmara Üniversitesi Teknik Eğitim Fakültesi Elektrik Eğitimi Bölümü Göztepe-İstanbul. TÜRKİYE. pg, 2(3), 4.
USGS, 2019. Landsat 8 (L8) Data Users Handbook. https://prd-wret.s3.us-west-2.amazonaws.com/assets/palladium/production/atoms/files/LSDS-1574_L8_Data_Users_Handbook-v5.0.pdf.
Wu, Z., & Zhang, Y. (2019). Water bodies’ cooling effects on urban land daytime surface temperature: Ecosystem service reducing heat island effect. Sustainability, 11(3), 787. https://doi.org/10.3390/su11030787
Xue, Z., Hou, G., Zhang, Z., Lyu, X., Jiang, M., Zou, Y., … & Liu, X. (2019). Quantifying the cooling-effects of urban and peri-urban wetlands using remote sensing data: Case study of cities of Northeast China. Landscape and Urban Planning, 182, 92-100. https://doi.org/10.1016/j.landurbplan.2018.10.015
Yu, C., & Hien, W. N. (2006). Thermal benefits of city parks. Energy and buildings, 38(2), 105-120. https://doi.org/10.1016/j.enbuild.2005.04.003
Yu, Z., Yang, G., Zuo, S., Jørgensen, G., Koga, M., & Vejre, H. (2020). Critical review on the cooling effect of urban blue-green space: A threshold-size perspective. Urban Forestry & Urban Greening, 49, 126630. https://doi.org/10.1016/j.ufug.2020.126630
Sign in to continue
Not a member yet? Sign up now

Administrative Assistant
Deniz Bol is the Administrative Assistant at SPACE Studies, where she supports the day-to-day operations and contributes to the smooth functioning of the organization. Alongside her administrative role, Deniz is an artist with a passion for creative expression. She is currently pursuing her studies at the University of the Arts London (UAL), where she continues to develop her artistic practice. Her organizational skills, paired with her artistic background, make her a valuable asset to the SPACE Studies team, helping bridge the worlds of administration and creativity.
E-mail: denizbol@spacestudies.co.uk

Digital Marketing Consultant
Murat Oktay is the Digital Marketing Consultant at SPACE Studies, where he provides strategic guidance to enhance our digital presence and community engagement. With a keen eye for digital marketing trends and best practices, Murat plays a key role in refining our content strategy, expanding our online reach, and connecting with a wider audience. His expertise in digital tools and innovative marketing techniques aligns with SPACE Studies’ mission as a social enterprise, ensuring that our campaigns are impactful and resonate with our commitment to social responsibility in architecture and design. Outside his work with SPACE Studies, Murat stays at the forefront of digital marketing advancements, continually exploring new tools and sharing his insights with peers.
E-mail: muratoktay@spacestudies.co.uk

Marketing Manager
Santa Noella Matabaro is the Marketing Manager of SPACE Studies, bringing her expertise in strategic planning, community engagement, and relationship-building to the organization’s mission as a social enterprise. With a background in Politics & Law from the University of Kent, Santa combines analytical insights with a creative approach to advancing SPACE Studies’ vision of fostering interdisciplinary dialogue in architecture, design, and urban planning. In her role, she develops targeted campaigns and strategic partnerships, building brand presence and fostering meaningful connections with the community. Santa’s collaborative and people-centered approach enhances SPACE Studies’ impact, aligning with its commitment to social responsibility and innovation in the built environment.
Academic Content Coordinator
Betul Uckan is an architect and dedicated academic with a background in both architectural practice and research. She holds a Master of Science in Architectural Design and a Bachelor’s degree in Architecture from Istanbul Technical University, where she cultivated her interests in architectural theory and design. Betul has gained experience as a research assistant in various universities, contributing to design studios and foundational courses. She has also worked in the field as an architect with projects focused on design, modeling, and construction, and has been involved in notable projects, including Maltepe Piazza and Emaar Square in Istanbul. With her expertise spanning both digital and material architecture, Betul brings a dynamic, interdisciplinary approach to her role as the Academic Programme Coordinator.
E-mail: betuluckan@spacestudies.co.uk
Senior Researcher & Managing Editor
Arghavan Pournaderi is a senior researcher in the field of architectural conservation and restoration, with an academic foundation in architecture and specialized expertise in historic sites and buildings. Completing her PhD at the Art University of Isfahan, Iran, in 2019, her research has contributed to the understanding of Iran’s architectural heritage, with a focus on Isfahan’s urban and architectural evolution during the Safavid period. In addition to her extensive research, Dr. Pournaderi has held academic positions at various institutions in Isfahan, teaching at both undergraduate and graduate levels. Her work extends beyond academia as she contributes to SPACE Studies as Senior Researcher & Managing Editor, where she oversees scholarly initiatives that foster deeper interdisciplinary dialogue in architecture and heritage conservation.

Senior Researcher & Educational Consultant
Gregory Cowan is a Senior Researcher and Educational Consultant at SPACE Studies, where he leads initiatives that bridge academic research and practical application in architecture and urban design. He contributes his extensive experience to mentoring postgraduate students, designing educational workshops, and guiding community-focused projects. Gregory is also a freelance academic at the University of Wales Trinity St David and the University of Westminster, and founder of The Architects Coach. His expertise spans architectural workspace analysis, professional development, and positive intelligence coaching.
E-mail: gregorycowan@spacestudies.co.uk

Senior Researcher
Alison Hand is a Senior Researcher at SPACE Studies. She is a painter and writer with an MA in Painting from the Royal College of Art. Alison’s work focuses on creating absurd, unstable heterotopic spaces and dialogues with painting history. She is currently the Artist in Residence for King’s College London Philosophy Department on the Dreams and Wakeful Consciousness Research Project, exploring themes of time and simultaneity in new work. Alison has received numerous awards for her painting and is currently working with Bloomsbury Publishers on a major essay on Drawing in Contemporary Art. She is also the BA Fine Art Programme Leader at Art Academy London and co-director of Cement Arts. Her role at SPACE Studies involves leading research projects, mentoring junior researchers, and contributing to our artistic and academic initiatives.
E-mail: alisonhand@spacestudies.co.uk

Senior Researcher
Julian Wild is a Senior Researcher at SPACE Studies and the Sculpture Program Leader at The Art Academy London. With over 30 years of experience in creating and exhibiting sculptures, Julian has worked with high-profile clients such as Cate Blanchett and the University of Oxford. A fellow and former vice president (2015-2019) of the Royal Society of Sculptors, his work has been featured at venues like Modern Art Oxford and Chatsworth House. At SPACE Studies, Julian leads research projects, mentors junior team members, and conducts workshops that blend art and urban studies. In his free time, he enjoys attending academic conferences and crafting new sculptures.
E-mail: julianwild@spacestudies.co.uk

Director of Publications & Senior Researcher
Elif Suyuk Makakli (Associative Professor) earned her PhD in Architecture from the Vienna University of Technology, where she studied the impact of technology on architecture under Prof. William Alsop. With extensive experience in architectural practice in Istanbul and Vienna, she is now an Associate Professor at FMV Isik University, focusing on design education and technology. At SPACE Studies, Elif serves as both the Head of Publications and Senior Researcher, guiding scholarly content and contributing to research initiatives. She is dedicated to mentoring and fostering design innovation.
E-mail: elifsmakakli@spacestudies.co.uk

Director of Research
Sanaz Shobeiri is an architect, urban designer, and landscape urbanist, currently a postdoctoral researcher in the Department of Planning at Queen’s University Belfast. Her research focuses on age-gender inclusiveness and the interplay of architectural, historical, political, and sociocultural dimensions in urban spaces, exemplified by her project on city centres in Belfast and Tehran. Sanaz holds a PhD in Urban Planning from the University of Tehran and has a robust portfolio in sustainability and urban theory. As Head of Research at SPACE Studies, she leads innovative research initiatives, fostering collaboration and academic excellence. In her free time, Sanaz enjoys exploring urban landscapes and supporting community development.
E-mail: sanazshobeiri@spacestudies.co.uk

Creative Director
Selin Gulce Sozmen is the Creative Director at SPACE Studies, where she leads the artistic vision and design strategy for the organisation. With a background in graphic design and visual arts, Selin has been instrumental in creating visually captivating books, journals, and event posters. Her role extends to developing and coordinating workshops and creative projects, ensuring that all visual materials meet the highest standards of quality and innovation. Selin’s dedication to creativity and excellence drives the visual and creative direction of SPACE Studies, making her an essential part of the team.
E-mail: selinsozmen@spacestudies.co.uk

Founder & Executive Director
Pinar Engincan is the Founder and Executive Director of SPACE Studies, an innovative social enterprise focused on fostering interdisciplinary dialogue and education in architecture and urban design. With extensive experience as a lecturer and researcher, Pınar holds a PhD in Architecture and has led numerous academic initiatives. Her career includes curriculum development, international collaborations, and research on housing and urban policies. Passionate about bridging academia and community, she champions accessible education and consultancy services, empowering individuals to shape the built environment.
E-mail: pengincan@spacestudies.co.uk